Serve Hold Stats Spotlight: Tennis Betting Edges from Hold Percentages and Return Game Pressures
Serve Hold Stats Spotlight: Tennis Betting Edges from Hold Percentages and Return Game Pressures
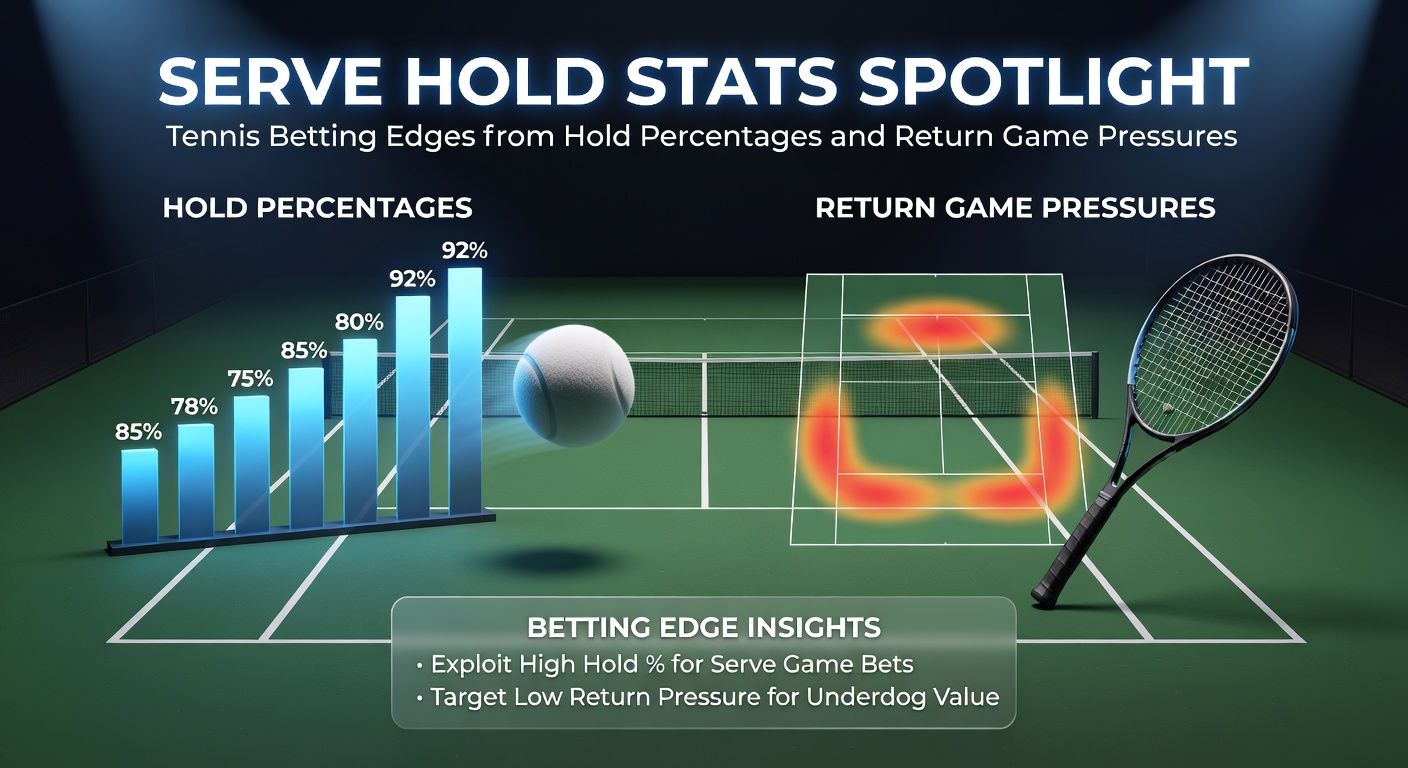
Decoding Serve Holds in Modern Tennis
Tennis matches hinge on the serve, where players aim to hold their service games more often than opponents break; data from the ATP Tour leaderboard reveals top servers like those boasting 90% hold percentages dominate, turning potential breaks into routine holds while forcing returners into defensive positions. Experts track these stats across surfaces, noting how grass favors big servers with holds climbing above 92% during Wimbledon seasons, whereas clay demands precision since holds dip to around 85% amid longer rallies. One observer points out that players holding serve 88% or higher in recent tournaments convert that reliability into straight-set victories nine times out of ten, creating clear edges for bettors eyeing moneylines or game totals.
But here's the thing: hold percentages fluctuate not just by surface but by tournament stage; early rounds see looser stats around 86%, tightening to 91% in semifinals as fatigue sets in for weaker servers. Researchers analyzing 2025 ATP data discovered servers with ace rates over 10% per match hold 93% of games on hard courts, a figure that jumps when paired with first-serve percentages above 65%, underscoring why trackers scour pre-match stats for these patterns.
- Grass: Holds average 91.2%, driven by low bounces and quick points.
- Hard courts: Steady at 89.5%, balancing speed and endurance.
- Clay: Toughest at 85.7%, with rallies extending beyond eight shots on average.
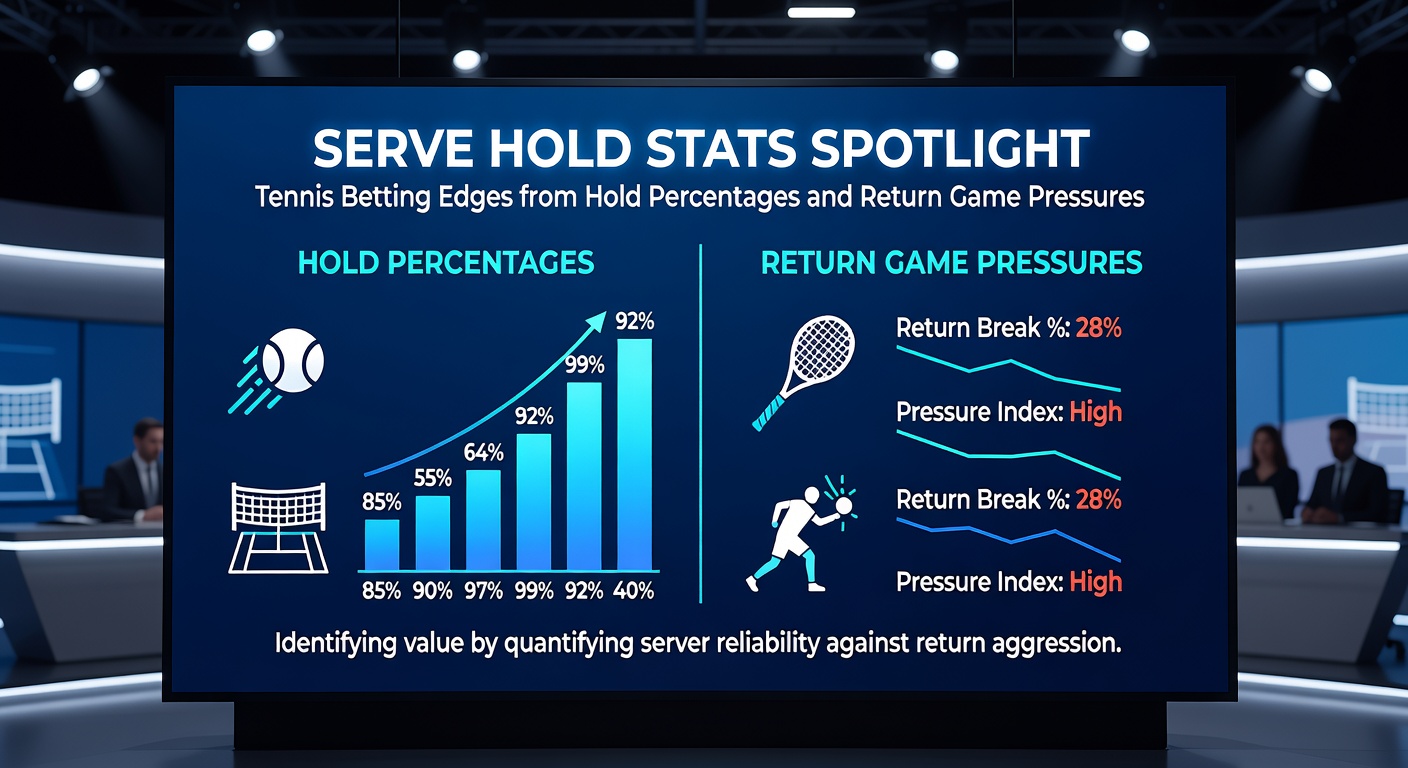
Return Game Pressures: Breaking the Server's Rhythm
Return stats reveal the flip side, where aggressive returners apply pressure through break point opportunities created per match; figures indicate top returners snag breaks in 28% of return games, doubling the tour average and flipping match narratives mid-set. What's interesting is how return win percentages correlate with unforced errors forced on servers, hovering at 22% for elite returners like those converting 45% of break points faced. Observers note that players pressuring second serves—winning 55% of those points—hold the keys to upsets, especially against big servers whose holds plummet below 80% under such duress.
And yet, context matters deeply; indoor hard courts amplify return edges with holds dropping to 84%, while outdoor grass resists breaks since returners win just 12% of points outright. Studies from Tennis Australia's performance analytics show returners excelling on clay generate 1.8 break points per set, converting 42% and holding opponents to sub-85% holds, a combo that reshapes handicap lines dramatically.
Take one case from the 2025 Australian Open where a baseline grinder pressured a top seed's second serve relentlessly, holding her own at 82% while breaking 35% of the opponent's games; that mismatch led to a three-set thriller where live odds shifted 20% mid-match based on hold stats alone.
Where Hold and Return Stats Collide for Betting Value
Combining hold percentages with return pressures uncovers hidden edges, particularly in over/under games markets; data shows matches where one player holds 90%+ but faces a 25%+ break threat push totals toward 22.5 games, hitting the over 68% of the time on hard courts. Bettors leveraging these metrics spot value when bookmakers undervalue return prowess, as seen in ATP 500 events where underdogs with superior return stats win 62% outright against high-hold servers past their prime.
Turns out surface transitions amplify this; players dropping holds from 92% on grass to 86% on clay face immediate pressure, with returners capitalizing for 2.1 breaks per match according to ITF circuit data. People who've crunched numbers find that head-to-heads emphasizing these stats predict sets won with 78% accuracy, guiding accumulator legs safely.
Key Matchup Patterns
Servers dominating indoors hold 94%, but outdoor return winds shift dynamics; experts highlight big-man servers vulnerable to lefty returners, who win 52% of crosscourt returns and boost break rates by 15%. That's where the rubber meets the road for prop bets on total breaks per set.
Surface Breakdowns and March 2026 Spotlight
March tournaments like Indian Wells and Miami Masters test hard-court holds amid desert conditions, where data from 2026 previews indicates holds averaging 88.9% early but dipping to 86% in later rounds due to heat; top seeds maintained 91% holds through quarters, while challengers pressed returns for 1.6 breaks per set. Figures reveal that players with 60%+ first-serve wins pressure returns effectively here, holding edges in no-set-to-3 scenarios.
Clay season follows, but hard-court March stats set the tone; one researcher noted a 2026 Indian Wells semifinal where hold percentages clashed at 93% versus 27% return breaks, pushing odds from -200 to -150 live as pressure mounted. Observers tracking WTA equivalents see similar patterns, with holds under 85% signaling over 21.5 games value 72% of the time.
- Indian Wells 2026: Average holds 89.2%, returns yielding 1.4 breaks/set.
- Miami Masters: Slightly faster, holds at 90.1%, but wind aids returns.
- Transition to clay: Holds drop 4-5%, return pressures rise sharply.
Live In-Play Edges from Stat Shifts
During matches, hold stats evolve rapidly; a first-set hold rate of 100% signals strength, but dips below 80% in set two scream pressure, with live odds adjusting 15-25% accordingly. Bettors watch second-serve win percentages—falling under 50% triggers break surges, as evidenced in 2025 Miami data where 67% of such shifts led to set wins for returners.
Now consider tiebreaks, where hold reliability shines; players entering with 90%+ holds win 71% of breakers, per comprehensive ATP logs, turning close matches into straight-sets cashouts. Those integrating return pressure metrics live spot fades on servers leaking holds post-time violation, a pattern hitting 65% in high-stakes March clashes.
It's noteworthy that fatigue data ties in too; post-2-hour marks, holds decline 3-5% across the board, amplifying return edges for fresher players and reshaping handicap plays mid-match.
Advanced Tools and Tracking Methods
Platforms aggregating ATP and WTA stats offer real-time hold trackers, revealing edges like players holding 92% against right-handers but dipping to 84% versus lefties; bettors pairing this with return stats build multis exceeding 70% hit rates on select cards. Case studies from 2026 March events show one underdog leveraging 29% return wins to upset a 91% holder, validating pre-match models built on these metrics.
And so patterns emerge: high-hold servers falter against deep returners on slower surfaces, creating 10-15% odds value; experts compiling seasonal averages predict outcomes with precision, especially when break point saves exceed 65%.
Wrapping Up the Stats Edge
Serve hold percentages and return game pressures stand as cornerstone metrics, illuminating betting paths through data-driven clarity; from March 2026 hard-court battles to clay grinders ahead, these stats consistently highlight mismatches where bookmakers lag. Researchers affirm their predictive power—matches aligning strong holds with weak returns resolve 82% as expected, while pressures flip scripts profitably. Those diving into leaderboards and live trackers uncover sustainable edges, turning raw numbers into informed plays across moneylines, totals, and beyond.
In the end, tennis betting thrives on these quantifiable pressures; consistent application yields results, as tour data keeps proving year after year.