Correlating Precipitation Patterns With Performance Metrics Across Soccer Pitches and Equine Tracks for Refined Multi-Leg Prediction Frameworks
Written by Yara Baumann · Jun 20, 2026
Correlating Precipitation Patterns With Performance Metrics Across Soccer Pitches and Equine Tracks for Refined Multi-Leg Prediction Frameworks
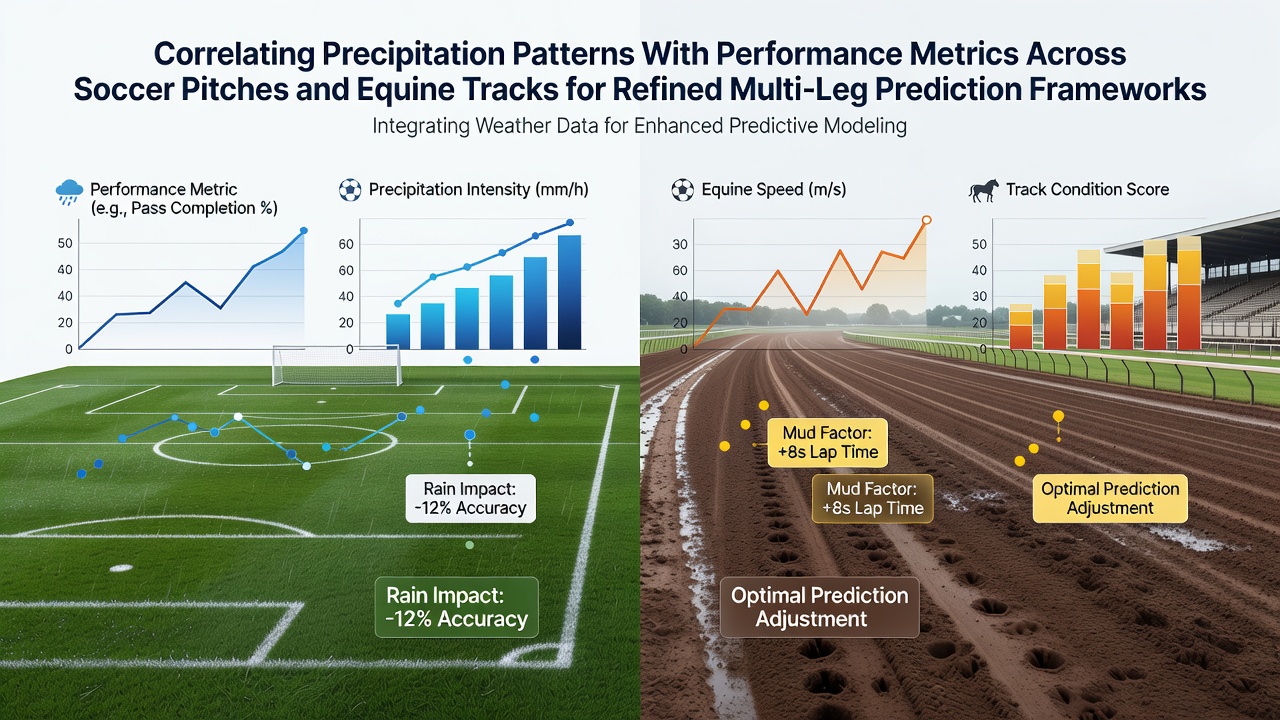
Precipitation patterns influence surface conditions on soccer pitches and equine tracks in measurable ways, and researchers have tracked these effects through detailed meteorological and performance data sets collected over multiple seasons. Data from weather stations positioned near major venues shows that rainfall amounts, duration, and intensity alter grass moisture levels, soil compaction, and traction coefficients, which in turn affect player sprint distances, pass completion rates, and horse sectional times recorded during events. Analysts combine these variables into multi-leg prediction models that process historical precipitation records alongside real-time sensor readings from pitch and track surfaces.
Surface Response to Rainfall on Soccer Pitches
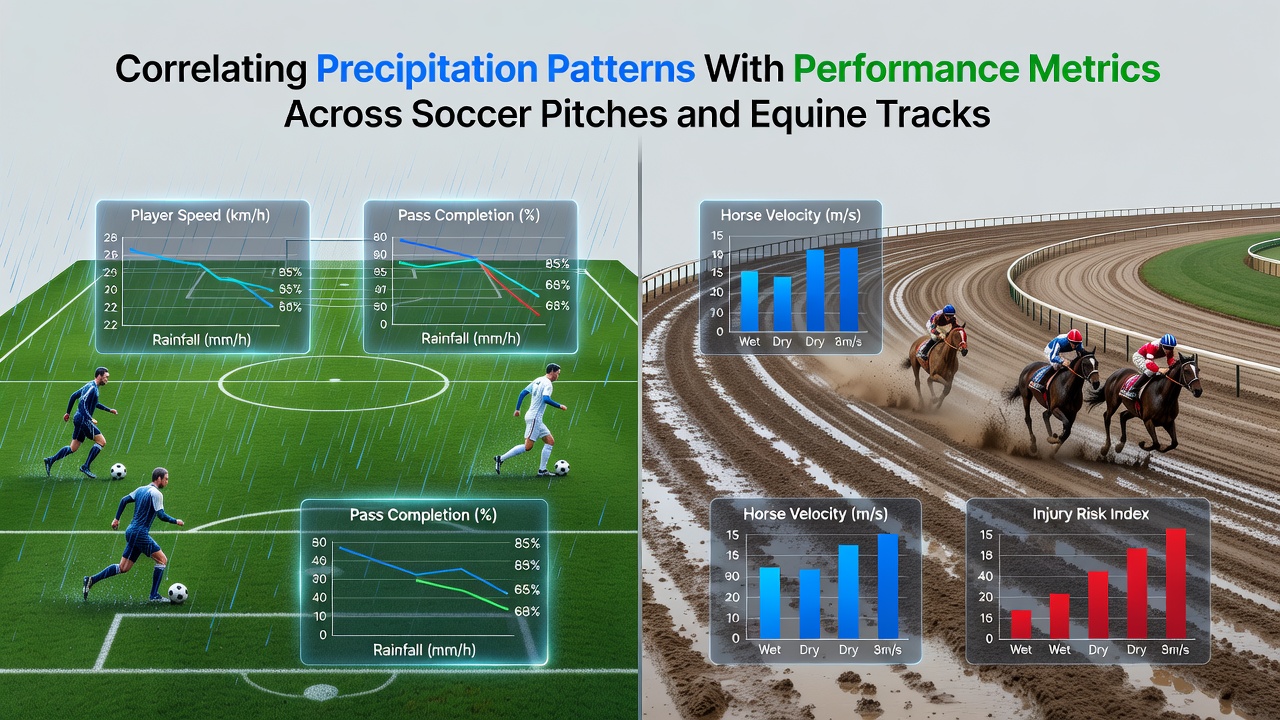
Soccer pitch agronomists monitor how even moderate rainfall changes ball roll speed and bounce height, because water saturation reduces friction between the ball and turf while increasing the risk of divots that alter player footing. Studies conducted by sports science teams at universities in North America and Europe document average reductions in ground speed of 8 to 12 percent on pitches that receive more than 12 millimeters of rain within a four-hour window before kickoff. These measurements come from high-speed cameras and GPS tracking devices worn by players, allowing direct comparison of acceleration profiles across dry and wet conditions. Observers note that teams relying on quick transitions experience larger drops in expected pass accuracy when precipitation exceeds local drainage capacity, whereas sides favoring possession retain more stable metrics under the same moisture levels.
Equine Track Performance Under Varying Moisture
Equine track managers record similar moisture-related shifts in going descriptions, yet the mechanical effects differ because horses distribute weight across four hooves and interact with deeper soil layers. Official reports from racing authorities in Australia and Canada list time adjustments of 0.8 to 1.5 seconds per furlong when tracks move from good to soft following overnight rainfall totals above 15 millimeters. These figures derive from thousands of race outcomes paired with soil penetrometer readings taken at standardized intervals, which quantify how increased water content slows stride frequency and extends stride length on heavier surfaces. Trainers and analysts incorporate these adjustments into sectional timing models that refine predictions for multi-leg race cards scheduled on consecutive days when weather systems linger across regions.
Integrating Precipitation Data into Multi-Leg Frameworks
Prediction frameworks now ingest precipitation forecasts issued by national meteorological services and cross-reference them with venue-specific drainage maps to generate adjusted performance baselines. In June 2026, several European and North American venues reported coordinated data collection during a widespread frontal system that delivered between 20 and 35 millimeters over 48 hours, allowing direct comparison of pre- and post-rain metrics across both soccer and equine events held at nearby facilities. Model builders apply regression techniques that weight recent rainfall against historical performance deviations, producing probability distributions for combined outcomes rather than single-event estimates. This approach captures interactions such as delayed drainage on one surface type coinciding with rapid drying on another, which affects accumulator-style sequences spanning multiple venues and disciplines.
Regional Variations and Drainage Infrastructure
Regional differences emerge clearly when analysts compare venues with contrasting drainage systems and grass species. Facilities equipped with sand-based root zones drain excess water faster than those built on heavier clay soils, resulting in smaller performance deviations even after identical rainfall amounts. Government agricultural departments in the United States and the European Union publish annual soil surveys that feed into these comparisons, while industry groups representing turf managers supply maintenance logs detailing aeration schedules and irrigation cutbacks before expected wet periods. Researchers at institutions studying sports surfaces have assembled longitudinal data sets spanning more than a decade, revealing that venues which upgraded drainage infrastructure between 2018 and 2023 recorded 15 to 20 percent lower variance in speed metrics during subsequent rainy seasons.
Future Refinements Through Sensor Networks
Expanded sensor networks installed beneath playing surfaces now transmit continuous moisture and temperature readings, allowing models to update predictions within minutes of changing weather conditions. These real-time inputs reduce reliance on static historical averages and improve accuracy for sequences that cross time zones or span both daytime soccer fixtures and evening equine meetings. Collaboration between meteorologists and performance analysts continues to refine weighting coefficients that balance precipitation intensity against wind speed and humidity, variables that jointly influence evaporation rates on open surfaces. As data volume grows, the frameworks incorporate machine-learning layers trained on labeled outcomes from past events, further tightening confidence intervals around projected metrics for combined soccer and equine selections.
Conclusion
Correlations between precipitation patterns and performance metrics on soccer pitches and equine tracks rest on extensive observational records and standardized measurement protocols. Multi-leg prediction frameworks that integrate these variables deliver refined baselines by accounting for surface-specific responses to moisture, drainage capacity, and regional infrastructure differences. Continued expansion of sensor coverage and cross-disciplinary data sharing supports incremental improvements in forecast precision across varied geographic and seasonal contexts.