Charting Venue Microclimates for Precision in Layered Event Selections Across Disciplines
Written by Eden Beck · Jul 27, 2026
Charting Venue Microclimates for Precision in Layered Event Selections Across Disciplines
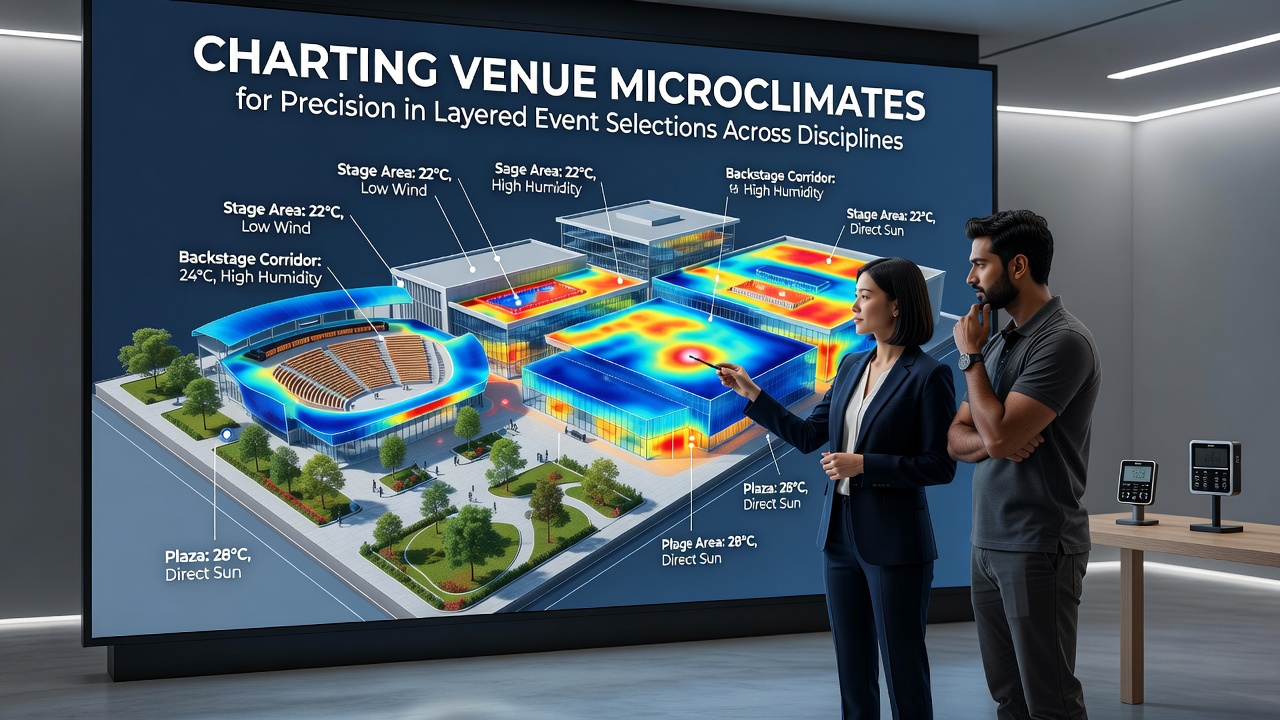
Venue microclimates represent localized climate variations that differ from broader regional weather patterns, and researchers have documented how these differences influence event planning across multiple disciplines including sports competitions, performing arts festivals, and large-scale conferences. Data collected from sensor networks at stadiums, arenas, and open-air grounds shows temperature gradients of up to four degrees Celsius within a single venue footprint while humidity levels can fluctuate sharply near water features or shaded structures. These variations matter because event organizers rely on precise environmental profiles when layering multiple activities such as morning track events followed by evening concerts or afternoon exhibitions paired with nighttime competitions.
Mapping Techniques and Data Collection Methods
Specialists deploy arrays of portable weather stations, drone-mounted infrared cameras, and ground-based lidar systems to chart microclimate zones, and studies conducted by institutions like the National Oceanic and Atmospheric Administration demonstrate that continuous monitoring over several seasons produces reliable heat maps of wind corridors, solar exposure pockets, and moisture retention areas. Analysts combine these readings with historical records from nearby airports to isolate venue-specific deviations, while software models interpolate between sensor points to generate three-dimensional climate layers. The resulting datasets allow planners to identify stable zones for equipment placement and high-variability zones better suited for shorter-duration activities that tolerate rapid condition shifts.
Applications Across Sports, Arts, and Conference Disciplines
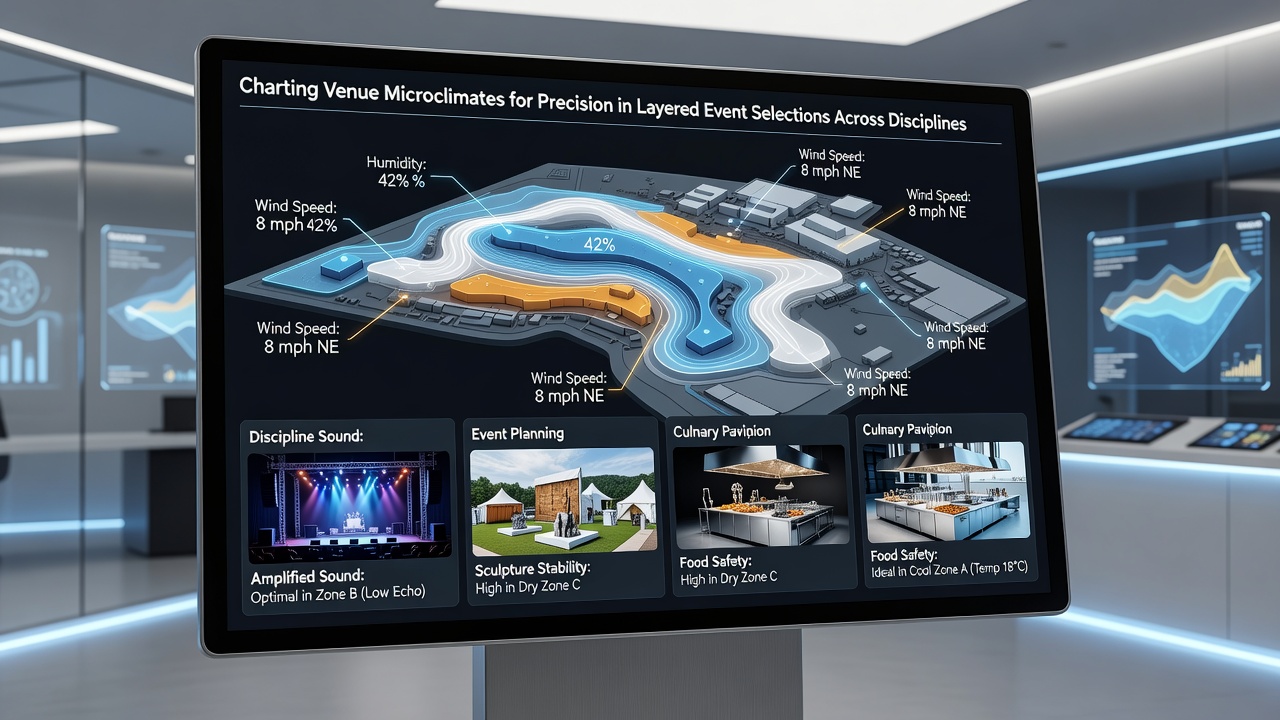
In athletic settings, microclimate charts guide decisions about start times for endurance events where elevated heat pockets increase participant risk, and similar data informs stage orientation for outdoor music performances where wind patterns affect sound projection and performer comfort. Conference organizers use humidity and temperature profiles to select indoor breakout rooms that maintain consistent conditions during extended sessions, whereas festival coordinators position food vendors and seating areas away from afternoon heat accumulation zones documented in multi-year studies. Across these disciplines the common thread remains the integration of microclimate layers into scheduling software that optimizes simultaneous or sequential event programming without relying on generalized regional forecasts.
Integration with Layered Event Programming
Precision selection becomes feasible when microclimate data feeds directly into decision matrices that weigh activity duration against environmental stability, and one documented case involved a European multi-sport complex where morning cycling races were routed through cooler valley sections while afternoon track events occupied sun-exposed straights only after cooling systems activated. Performing arts groups have adjusted rehearsal schedules around documented afternoon wind gust zones that previously disrupted aerial choreography, and academic conferences have shifted poster sessions to interior atriums identified as thermally stable through sensor arrays. These adjustments occur because layered programming requires overlapping activities whose environmental needs do not conflict, and microclimate charting supplies the spatial resolution needed to avoid such conflicts.
Recent Developments and July 2026 Projections
Advances in low-cost sensor technology have expanded coverage at mid-sized venues, and figures released by the European Centre for Medium-Range Weather Forecasts indicate improved forecast accuracy for localized effects when real-time venue data supplements global models. In July 2026 several international events are scheduled at facilities already equipped with integrated microclimate networks, allowing organizers to test dynamic rescheduling protocols that respond to detected changes within thirty-minute windows. Observers note that these protocols combine automated alerts with human oversight to maintain safety margins across disciplines that share the same physical space on consecutive days.
Challenges in Standardization and Data Sharing
While individual venues have developed proprietary mapping systems, cross-discipline standardization remains limited because sports governing bodies emphasize heat stress indices whereas arts organizations prioritize acoustic and comfort variables, and researchers continue to work on unified metrics that accommodate both sets of priorities. Privacy concerns arise when detailed environmental data reveals operational patterns, prompting some facilities to release aggregated rather than granular readings. Despite these hurdles, collaborative projects between university meteorology departments and venue operators have produced open-source toolkits that smaller organizations can adapt without substantial investment.
Conclusion
Charting venue microclimates supplies the environmental granularity required for precise, layered event selections that span athletic, artistic, and academic disciplines, and ongoing refinements in sensor networks and modeling techniques continue to expand the practical applications of this approach at facilities worldwide. The integration of localized climate data into scheduling frameworks reduces conflicts between concurrent or sequential activities while supporting evidence-based decisions grounded in multi-season observations.