Atmospheric variables: decoding precipitation effects on racing times, tennis bounce, and football traction for informed selections
Precipitation alters surface conditions in measurable ways that reshape performance metrics across horse racing, tennis, and football, and observers track these shifts through historical data sets to refine selection processes. Rain changes soil moisture levels, which directly influences friction, speed, and rebound characteristics, while forecasters combine radar readings with venue-specific reports to anticipate adjustments in race times, ball trajectories, and player movement patterns.
Track moisture and racing times
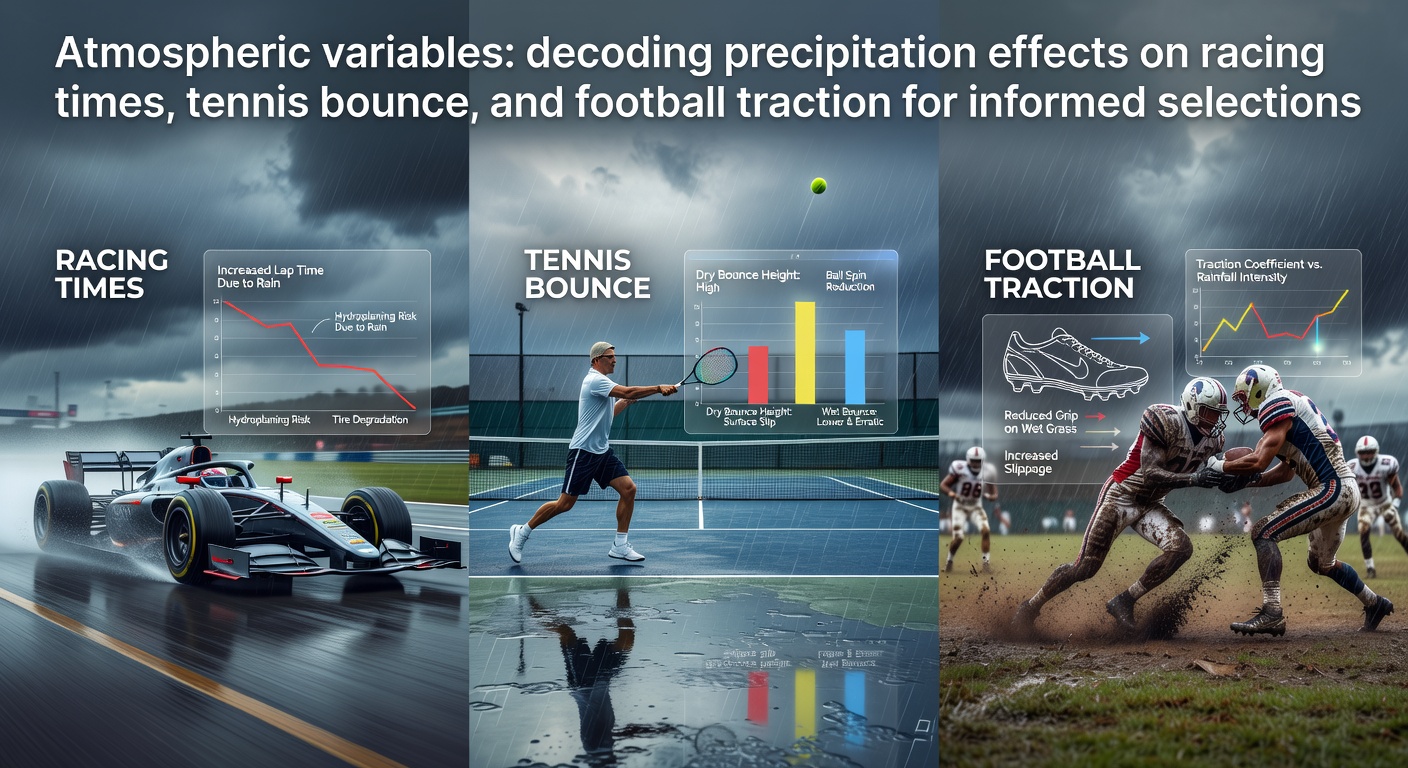
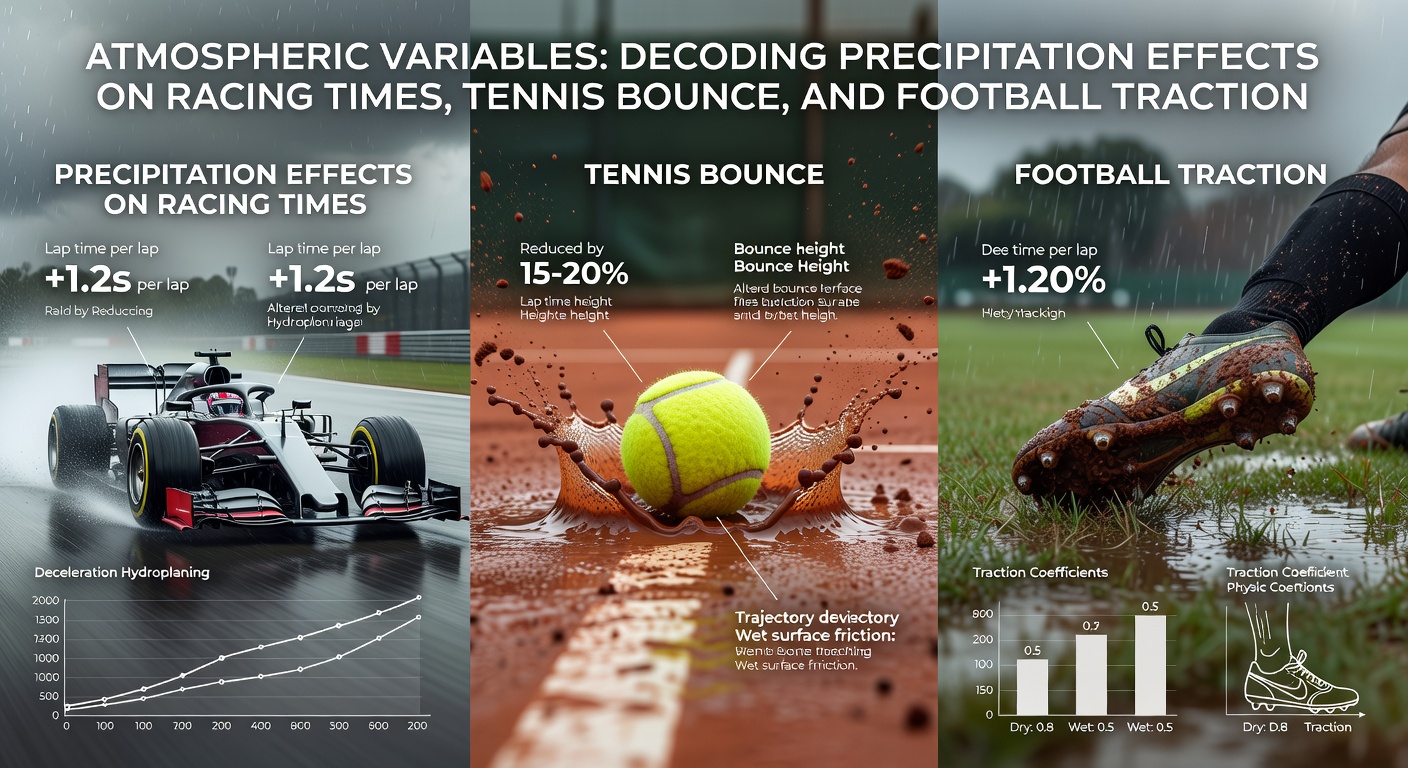
Heavy rainfall saturates turf and dirt surfaces at racecourses, which increases resistance and extends winning times by several seconds per furlong according to records maintained by track management authorities. Jockeys and trainers review official going reports that classify conditions from firm to heavy, and these classifications correlate with documented slowdowns when water content rises above baseline thresholds. Data compiled by regional meteorological services show that a sudden downpour during a meeting can shift average times by 2 to 5 percent on turf tracks, whereas synthetic surfaces absorb moisture differently and maintain more consistent clockings unless drainage fails. Those compiling selections cross-reference hourly rainfall totals with past performance charts to identify runners whose prior results align with wet conditions rather than assuming uniform impacts across all entrants.
Surface response in tennis
Tennis courts react to rain through changes in grip and bounce height, with grass courts losing pace rapidly once moisture accumulates while clay courts absorb water and produce higher, slower rebounds. Hard courts exhibit intermediate behavior where standing water creates unpredictable skids until crews apply drying procedures. Tournament organizers publish court condition updates that cite friction coefficients measured on site, and players adjust footwork and swing paths accordingly when these values drop below dry-weather norms. Studies conducted by sports science departments at universities in Australia and North America indicate that ball speed on grass can decrease by up to 15 percent after moderate rainfall, prompting analysts to factor surface-specific slowdowns into match projections rather than relying solely on player rankings. Selection frameworks therefore incorporate venue weather histories to distinguish matches likely to extend into longer rallies from those that retain baseline pace.
Player footing and football traction
Football pitches lose traction as rainfall increases surface water, which reduces stud penetration and raises the frequency of slips during acceleration and directional changes. Groundskeepers monitor soil saturation through on-site sensors, and league protocols sometimes trigger pitch inspections when precipitation exceeds set limits. European and Canadian research consortia have measured stride length reductions of 8 to 12 percent on waterlogged fields compared with dry conditions, with data sets linking these changes to altered pass completion rates and tackle success percentages. Teams review such metrics alongside forecast models to anticipate which squads adapt more effectively to slick surfaces, particularly during periods when multiple fixtures occur within short timeframes. Selection processes therefore integrate pitch reports and precipitation forecasts to identify contests where traction variables may favor sides with specific tactical profiles.
Cross-sport data integration during May 2026
May 2026 features overlapping schedules that include spring turf meetings, clay-court tournaments, and late-season league fixtures, creating opportunities for analysts to apply unified weather models across disciplines. National meteorological agencies supply localized rainfall probabilities that feed into algorithms comparing historical performance deltas under similar moisture levels. Observers combine these inputs with venue drainage statistics to generate adjusted performance baselines, while industry reports from trade associations highlight how consistent data pipelines reduce variance in projected outcomes. Analysts who maintain multi-sport databases note that precipitation events spanning several days can produce compounding effects when tracks, courts, and pitches share regional weather systems, and they adjust selection parameters accordingly rather than treating each sport in isolation.
Practical measurement techniques
Professionals employ portable moisture meters, drone imagery, and real-time radar overlays to quantify precipitation effects at individual venues. These tools generate numeric values for surface hardness and water film thickness that feed directly into statistical models used for selections. Research published by North American academic centers demonstrates that integrating such granular readings improves correlation between predicted and actual performance metrics compared with forecast-only approaches. Organizations responsible for standardizing sports surfaces publish guidelines that translate moisture readings into expected speed and bounce adjustments, allowing systematic incorporation of atmospheric data into daily decision frameworks.
Conclusion
Atmospheric variables tied to precipitation produce measurable, sport-specific alterations in racing times, tennis bounce, and football traction, and structured data collection enables objective integration of these factors into selection processes. Continued refinement of measurement tools and cross-referenced historical records supports consistent application across overlapping schedules such as those in May 2026.